

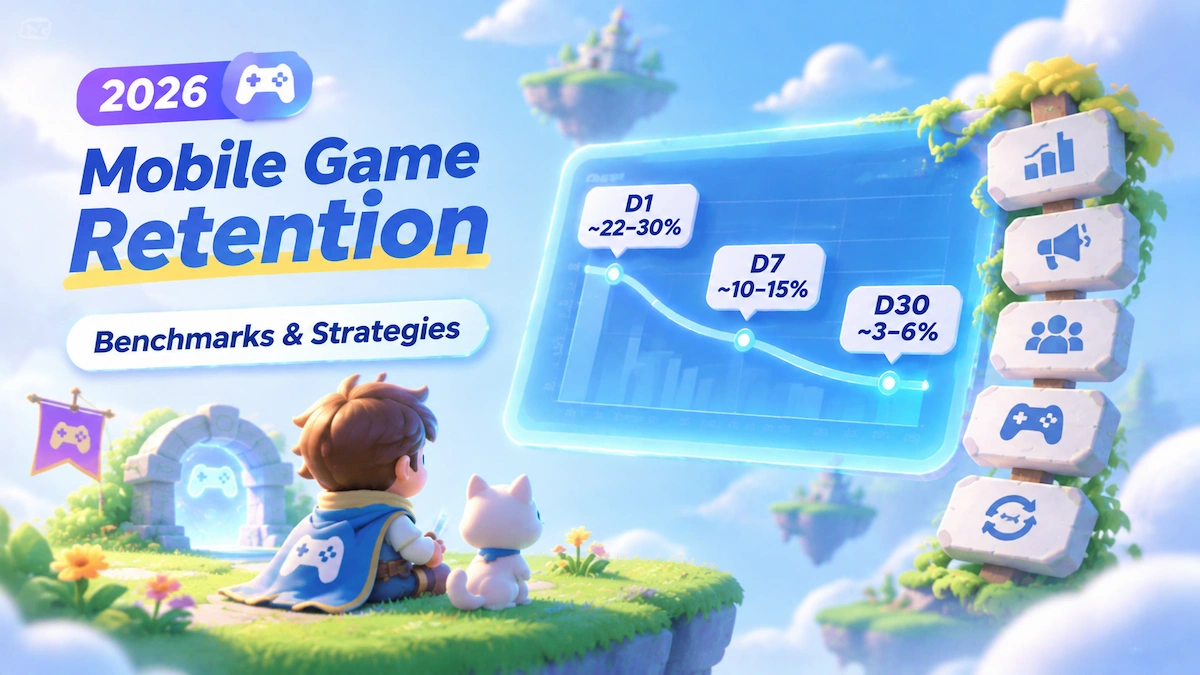
Getting players to install a game is only the first step. The bigger challenge in mobile game retention is giving players enough reasons to keep playing after the first session. Across the industry, the median mobile game keeps only about one in five players on Day 1, and fewer than 1% are still playing by Day 30.
Most of that loss happens early. Retention also varies widely from one game to the next, shaped by genre, platform, and region, which makes a single retention number hard to judge on its own. A rate that looks weak in one context can be perfectly healthy in another.
This guide looks at where mobile game retention stands in 2026, what a good retention rate looks like, and how game teams can improve it.
Key Takeaways
- Use retention benchmarks as context, not universal targets. GameAnalytics’ 2026 report, based on 2025 data from 16,000+ mobile games with at least 1,000 MAU, puts median D1 retention at around 22%, D7 just under 4%, and D30 at roughly 0.7–0.8%.
- Compare like-for-like cohorts. A useful benchmark should reflect your game’s genre, platform, region, and retention measurement method. Segment organic and paid acquisition sources to uncover differences that blended retention figures can hide.
- Use D1, D7, and D30 to guide investigation. Low D1 warrants checking onboarding and technical performance; weak D7 or D30 calls for examining progression, rewards, and content. Validate these signals with behavioral data rather than treating them as proof of a specific cause.
- Combine player feedback with in-game behavior to prioritize fixes. Check recurring complaints against crashes, tutorial completion, level abandonment, and progression data. Assign ownership based on the issue, and prioritize by player impact rather than review volume alone.
- Give players reasons to return, then measure what changes. Adapt progression, rewards, and LiveOps to your genre and resources. After updates, monitor technical issues and player feedback immediately, then evaluate D7 and D30 as cohorts mature.
What Is Mobile Game App Retention Rate and How to Calculate It?
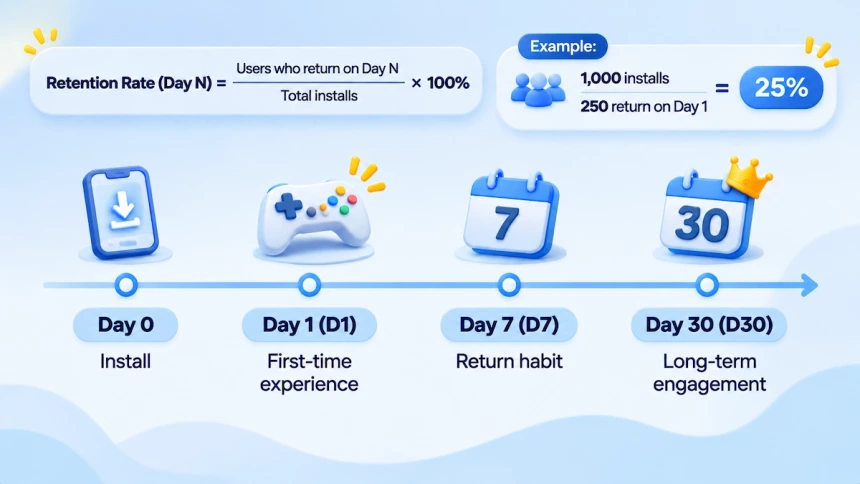
Mobile game retention measures the percentage of players who return to a game on a given day after installing it. Day N retention is the number of users from an install cohort who are active on Day N, divided by the total number of users in that cohort, multiplied by 100%. The install date is Day 0. For example, if 1,000 players install a game and 250 open it on Day 1, the D1 retention rate is 25%.
The same calculation can be applied to later days to track how player engagement changes over time. D1, D7, and D30 are the most commonly tracked milestones: D1 signals the quality of the first-time experience, D7 shows whether a return habit is forming, and D30 reflects longer-term engagement.
It is worth noting that retention benchmarks should be used with caution, as figures vary with how a “return” is defined, how days are counted, and the genre, platform, region, and data source covered. Compare your results only with benchmarks built on a similar basis.
What Is a Good Mobile Game Retention Rate?
There is no single retention rate that works as a benchmark for every mobile game. A useful comparison needs to account for the games included in the dataset and how their retention is measured.
According to 2026 Mobile & PC Gaming Benchmarks, published by GameAnalytics, the mobile gaming benchmarks are based on data collected throughout 2025. The dataset covers more than 16,000 mobile games across nine regions. Each game must have at least 1,000 monthly active users (MAU) to qualify.
The following table shows the median retention rates across the global mobile game sample.
| Metric | Global Mobile Games, Median |
| D1 Retention | ~22% |
| D7 Retention | Just under 4% |
| D30 Retention | ~0.7%–0.8% |
(Source: GameAnalytics, 2026 Mobile & PC Gaming Benchmarks)
These figures represent the median performance of games that meet the report’s 1,000 MAU threshold. They are not averages calculated specifically for games with paid user acquisition campaigns. When comparing your game with these benchmarks, consider its genre, platform, region, and retention measurement method. These factors help explain why your results may differ from the overall median.
The next section breaks down mobile game retention benchmarks by platform, genre, and region to show how retention rates vary across different gaming segments.
Mobile Game Retention Rate Benchmarks by Platform,Genre and Region (D1, D7, D30) in 2026
Mobile Game Retention Rate Benchmarks by Platform
iOS retains more players than Android at Day 1, Day 7, and Day 30. The relative gap between the two platforms is larger at later checkpoints, with a more noticeable difference at D30 than at D1. On both platforms, the steepest decline occurs within the first week, while the curves flatten noticeably after Day 7.
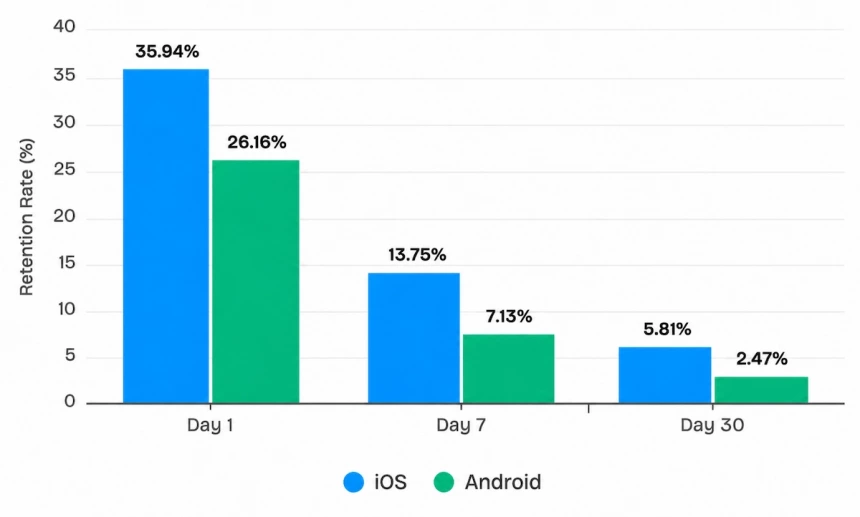
(Source: Businessof Apps)
Mobile Game Retention by Genre
- iOS: RPG has the highest Day 30 retention, and hypercasual has the lowest.
- Android: Casino has the highest Day 30 retention, with puzzle and RPG close behind. Hypercasual again has the lowest.
- Platform comparison: iOS retains more players than Android in every genre at all three checkpoints. RPG’s lead is clearest on iOS and narrows on Android, while hypercasual is the weakest long-term genre on both platforms.
iOS Mobile Game Retention Rate Benchmarks(Q3 2026)
| Game genre | Day 1 | Day 7 | Day 30 |
| Action | 30.15% | 9.33% | 2.28% |
| Casino | 29.42% | 11.84% | 3.98% |
| Hypercasual | 28.52% | 6.31% | 1.26% |
| RPG | 33.77% | 13.49% | 4.53% |
| Puzzle | 29.95% | 11.41% | 3.83% |
| Racing | 28.32% | 8.54% | 1.93% |
| Strategy | 30.48% | 11.61% | 3.65% |
Android Mobile Game Retention Rate Benchmarks(Q3 2026)
| Game genre | Day 1 | Day 7 | Day 30 |
| Action | 21.59% | 4.28% | 0.77% |
| Casino | 23.31% | 9.00% | 2.91% |
| Hypercasual | 22.61% | 3.94% | 0.67% |
| RPG | 26.43% | 8.86% | 2.61% |
| Puzzle | 25.63% | 8.99% | 2.85% |
| Racing | 20.13% | 4.02% | 0.72% |
| Strategy | 22.95% | 7.10% | 2.04% |
(Source: AppsFlyer)
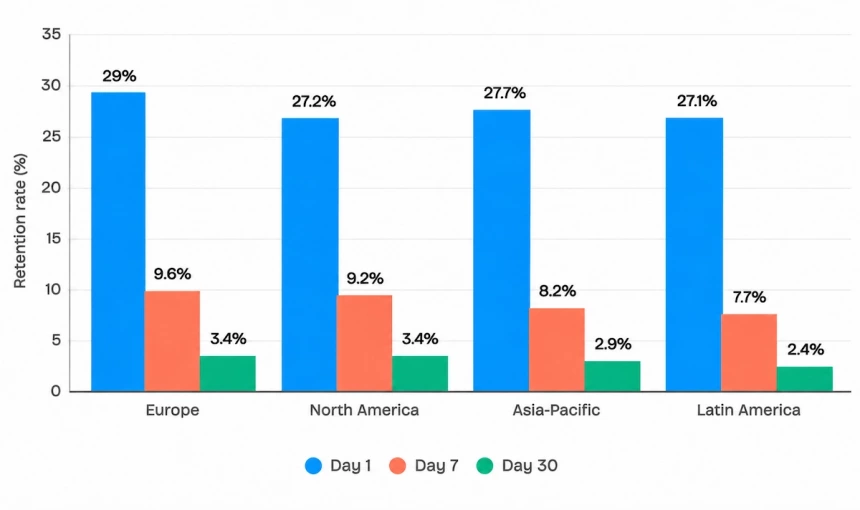
Mobile Game Retention Rate Benchmarks by Region
Europe records the highest retention rates at both D1 and D7. At D1, Asia-Pacific slightly outperforms North America. However, North America takes the lead over Asia-Pacific at D7. By D30, Europe and North America share the top spot, both at 3.4%. Latin America has the lowest retention at all three stages.
(Source: Businessof Apps)
How to Improve Mobile Game Retention
When deciding how to increase app retention in a mobile game, start with where players lose interest and what prevents them from returning. The following five strategies connect those patterns with acquisition sources, player feedback, and the game experience.
Strategy 1: Identify When Players Drop Off
Retention metrics tell you when players stop coming back, but they rarely explain why. A low D1, D7, or D30 retention rate is only the starting point. Before deciding how to improve retention, game teams first need to identify where players begin disengaging and what they were doing before they left.
Start with the retention curve instead of a single metric. D1, D7, and D30 each represent a different stage of the player journey. Looking at them together helps narrow down where the experience starts to break down. For example, a game with healthy D1 retention but a sharp decline by D7 usually faces a different problem from one that loses players immediately after installation.
Once you know when players are leaving, move beyond the retention dashboard. Review tutorial completion, level abandonment, session frequency, progression milestones, and other behavioral events to find the exact point where engagement begins to fall. Instead of asking why D7 is low, ask questions such as:
- Do players leave before finishing the tutorial?
- Does activity drop after a specific level or progression milestone?
- Are players returning less often after their first few sessions?
These patterns provide a starting point for investigation rather than definitive answers. The goal is not to explain the cause yet, but to narrow the search before looking at acquisition quality, player feedback, or game design.
Homa’s Balls vs Lasers illustrates this process well. The team analyzed where players stopped playing alongside session duration and interstitial ad impressions. Based on those findings, it redesigned the level roadmap and introduced new gameplay variations. The changes increased overall session time by 18% and D1 retention by 14%, showing how identifying the right drop-off point can lead to more targeted improvements.
Strategy 2: Segment Retention by Acquisition Source
Overall retention can hide differences between acquisition sources. Segment players by organic and paid installs, then break paid cohorts down by network, campaign, and creative. Compare D1, D7, and D30 to identify which sources bring players who keep engaging.
Use comparable observation windows and sufficient samples. Geography, platform, device, and audience composition can also affect results, so retention gaps alone do not establish traffic quality.
| Retention pattern | What to investigate |
|---|---|
| Healthy organic but weak paid retention | Targeting, traffic quality, campaign optimization |
| Weak retention across both | Onboarding, gameplay, progression, technical issues |
| Large differences between paid channels | Audiences, placements, geographic mix |
| Strong D1 but weak D7 in one channel | Player intent, incentives, gameplay expectations |
Treat these patterns as clues. Validate them against campaign settings, attribution data, and player behavior before making changes.
The acquisition mix can also evolve over time. For Idle Survivors: Last Stand in Germany and France, we explored whether the channels that established App Store visibility would remain effective once the game gained traction.
We combined ASO with Google, Facebook, and TikTok campaigns, adjusting timing around competitor activity. Later, we gradually reduced those paid channels’ share of acquisition. Over two months, the game reached No. 1 on the App Store free games charts in both markets multiple times.
Ranking success shows visibility; assessing retention requires tracking players beyond installation. Compare cohorts by both source and campaign phase, then use player feedback and in-game behavior to investigate the differences.
Strategy 3: Combine Player Feedback and Behavioral Data
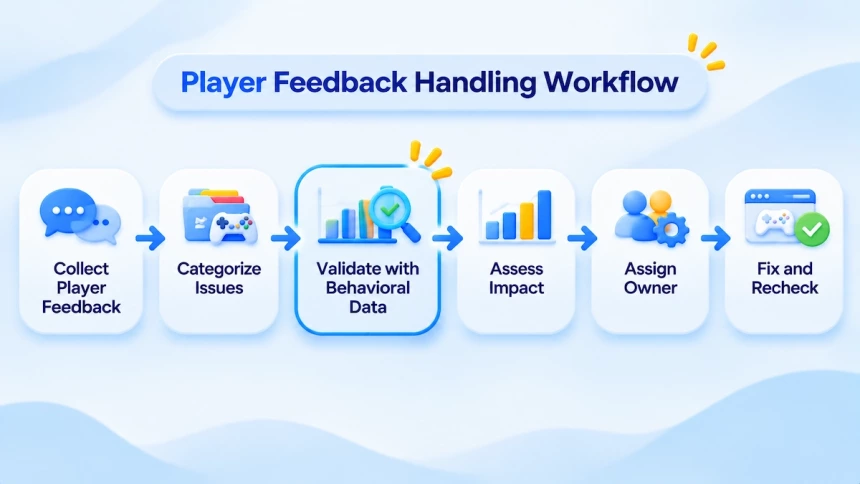
Once you have identified the player groups and retention patterns that need further investigation, examine player feedback to uncover potential problems. Combining these insights with behavioral analytics helps teams validate reported issues and assess their impact on player retention.
1. Categorize Player Feedback
Review App Store and Google Play feedback to identify recurring complaints. Group similar comments into categories to make common problems easier to track and assign to the right teams.
| Churn category | Common player complaints | Responsible team |
| Technical issues | Crashes, login failures, lag | Engineering / QA |
| Onboarding friction | Confusing tutorials, difficult controls | Product / Game Design |
| Difficulty balance | Unfair matchmaking, sudden difficulty spikes | Game Design |
| Game economy | Weak rewards, expensive upgrades, slow progression | Product / LiveOps |
| Content fatigue | Repetitive events, lack of new content | LiveOps |
Pay attention to recurring complaints and version-specific feedback. A sudden increase in negative reviews after an update, for example, may indicate a new technical or gameplay issue.
2. Validate Feedback with Behavioral Data
After grouping player complaints, compare each category with relevant in-game metrics. This helps determine whether reported issues are reflected in actual player behavior and how significantly they affect the game.
| Player feedback | Behavioral data to validate |
| Players report frequent crashes | Crash rate by device and game version |
| Players complain about difficult tutorials | Tutorial completion and early-session abandonment |
| Players report unfair difficulty | Failure rates, repeated attempts, and abandonment by level |
| Players complain about slow progression | Progression speed, time to reach progression milestones, and upgrade completion |
| Players find events repetitive | Event participation, completion rates, and repeat engagement |
For example, if players report that a particular level is too difficult, check whether abandonment and failure rates are unusually high at that level. If both player complaints and behavioral data point to the same issue, the team has stronger evidence for further investigation.
3. Prioritize Issues Based on Impact
Not every complaint requires immediate action. Prioritize problems based on their potential effect on retention and the resources needed to resolve them.
Consider five factors:
- Frequency: How often does the issue appear in player feedback?
- Retention impact: How many players could be affected?
- Affected segments: Which player groups, devices, or acquisition cohorts are impacted?
- Version relevance: Is the problem concentrated in a particular game version?
- Resolution cost: How much time and effort will it take to address the issue?
Do not use review volume alone to determine priority. A frequently mentioned issue may affect a relatively small group, while a less visible technical problem could be causing significant player drop-offs.
4. Assign Ownership and Track Follow-Through
With priorities established, give each issue a clear owner using the team responsibilities outlined above as a starting point. When a problem spans several teams, designate one lead to coordinate the investigation and agree on the next steps. Record the planned action and the evidence needed to assess the result, so each issue can be followed through from investigation to review after a fix.
Strategy 4: Build Reasons for Players to Return
Fixing the issues that drive players away is only part of improving retention. Players also need something to look forward to when they return. As teams work on D7 and D30 retention, progression, rewards, and fresh content offer three connected ways to sustain that interest.
1. Improve Player Progression
A clear sense of progress helps players see what they can achieve in their next session and what they are working toward over time. Short-term goals make it easier to decide what to do next, while longer-term objectives give individual sessions a broader purpose.
Teams can strengthen progression through several design choices:
- Set achievable short-term goals alongside longer-term objectives.
- Make upgrades and unlocks open up useful options or new gameplay.
- Adjust difficulty where repeated failures bring progress to a halt.
- Use clear progress indicators so players can see how far they have come.
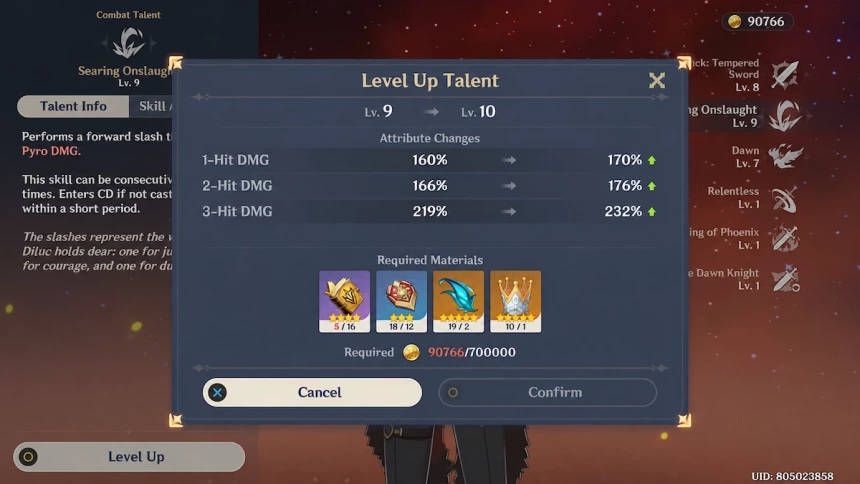
Genshin Impact illustrates how different progression paths can work together. Players develop characters through levels, talents, weapons, and artifacts while advancing through the story and exploring new areas. Together, these paths give players immediate goals for their next session and longer-term ambitions to work toward.
(Credit:Hoyoverse)
2. Design Meaningful Reward Systems
Rewards can support these goals by making each session feel worthwhile. Daily bonuses may encourage players to open the game, but their value depends on how well they connect to activities and objectives players already care about.
| Reward Type | Purpose |
| Daily rewards | Support short sessions with useful resources. |
| Weekly challenge rewards | Recognize effort across several sessions. |
| Milestone rewards | Mark significant progress or achievements. |
| Event rewards | Make participation in temporary activities worthwhile. |
For example, a weekly challenge might offer resources toward an upgrade players are already pursuing. The reward then supports an existing goal while giving players a reason to return over several sessions.
The effort required should also feel proportionate to the reward. If routine tasks take too long or missing a day makes progress feel out of reach, the system can become frustrating. Review participation and completion patterns alongside player feedback to understand whether rewards are supporting engagement or making play feel like an obligation.
3. Maintain Engagement Through LiveOps and Content Updates
Progression gives players goals, and rewards make their effort feel worthwhile. Over time, however, familiar activities can still lose their appeal. LiveOps and content updates help sustain interest by introducing new challenges and experiences.
Plan updates around how players move through the available content. If engaged players are completing it faster than the team can expand it, smaller additions, such as rotating challenges or variations on existing modes, may help maintain interest between larger releases. Give players enough time to enjoy each activity, and use participation, completion, and repeat engagement to inform future updates.
The release schedule also needs to fit production capacity. Rushing to fill the calendar can reduce quality and leave little time to respond to feedback. A manageable schedule gives the team room to improve existing activities while developing new ones.
The right mix of progression, rewards, and content updates will vary by genre and available resources. Focus on systems that fit your core gameplay and that your team can sustain over time.
Strategy 5: Monitor Player Retention After Game Updates
A game update may address a known problem, introduce new content, or adjust the player experience. Whatever its purpose, teams need to check whether it delivers the intended improvement. Start by watching for immediate issues, then evaluate retention as enough post-update data becomes available.
1. Evaluate Retention After Each Game Update
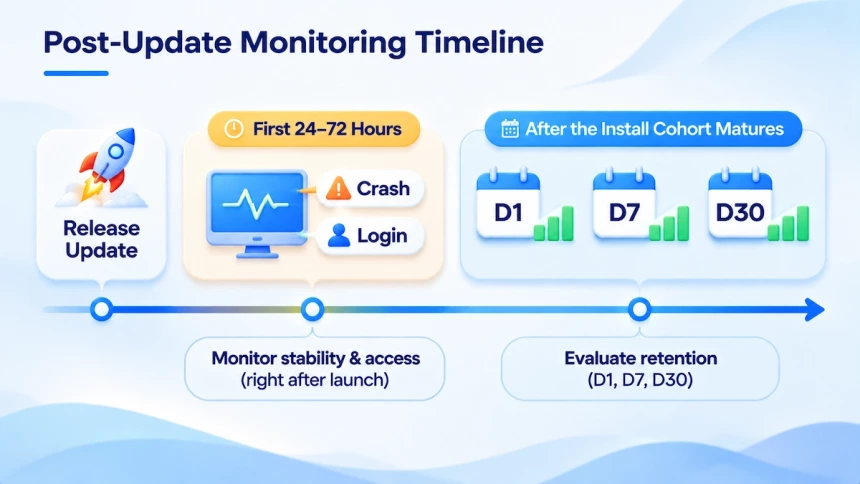
In the first 24 to 72 hours after a release, monitor crash rates, login success, and the gameplay metrics most relevant to the changes. These early signals can help teams spot problems while post-update cohorts are still too young to measure D7 or D30 retention.
As those cohorts mature, compare their D1, D7, and D30 retention with comparable pre-update cohorts. Keep acquisition source, platform, region, and observation windows consistent where possible, and break results down by game version and affected player groups. This helps distinguish changes associated with the update from differences in the players entering the game. Where practical, use an A/B test to assess the update’s effect more clearly.
2. Keep Store Content Aligned with the Updated Game
Alongside these checks, review whether the store page still reflects the experience players will encounter after installing. Screenshots, preview videos, and promotional descriptions can become outdated when an update changes gameplay, rewards, or available content.
When launching or ending an activity, update the relevant In-App Events and promotional assets so that descriptions, rewards, and schedules remain accurate. Players should also be able to find the promoted content easily in the game. Keeping these details aligned helps new players enter with accurate expectations.
3. Check Whether Fixes Resolved Player Concerns
For updates that address player complaints, return to the specific issues the team intended to fix. Check whether those reports become less frequent in reviews for the new version and whether the corresponding metrics improve among affected players.
For example, after fixing a progression blocker, look for fewer reports of players getting stuck and higher completion rates at that point. A decline in complaints alone is not enough to confirm success, particularly if overall review volume has also fallen. If players continue reporting the problem or the relevant metrics show little improvement, investigate further before considering the issue resolved.
Build a Retention Monitoring Checklist
Retention metrics can lag behind player problems. Reviews, community discussions, and support tickets may reveal warning signs earlier. Use this checklist to define monitoring responsibilities, review schedules, and follow-up actions.
| Signal source | What to check | Cadence | Owner | Action and follow-up |
|---|---|---|---|---|
| Store reviews | Recurring complaints, version-specific issues, rating changes | Weekly; daily after releases | Community / Support; QA / Product as needed | Categorize, assign, and review after fixes. |
| Reddit, Discord, forums | Update, reward, balance, and event concerns; repeated bugs | Daily scan; weekly summary | Community; Product / LiveOps | Respond, escalate patterns, track sentiment. |
| Support tickets | Account issues, missing purchases, lost progress, recurring technical problems | Daily | Support; Engineering for defects | Group issues, escalate defects, follow up. |
| Technical data | Crash-free users, ANRs, login and payment success | Daily alerts; intensive checks 24–72 hours after updates | Engineering / QA | Escalate, communicate fixes, verify recovery. |
| Paying-player data | Purchase failures, missing items, refunds, payer versus non-payer retention | Weekly; immediate payment-failure alerts | Product / LiveOps; Engineering | Resolve payment issues, restore purchases, compensate affected players. |
| Retention and engagement | D1/D7 by source and version; event participation, login frequency | Weekly; D30 monthly | Product / LiveOps | Compare segments, investigate changes, adjust strategies. |
| Store performance | Ratings, complaints, keywords, conversion, promotional accuracy | Monthly; sooner if performance declines | Marketing / UA; Product | Update assets, promotions, and In-App Events. |
Urgent issues—including crashes, failed logins, lost progress, and missing purchases—require immediate escalation rather than waiting for scheduled reviews.
Track detection, acknowledgment, and resolution times, plus open issues, to identify delays and improve the response process.
Make Player Retention an Ongoing Process
Improving mobile game retention takes more than identifying where players drop off. Game teams need to understand why players leave, address the problems affecting their experience, and measure whether those changes actually work. Retention metrics show where performance falls short, while player feedback and behavioral data help uncover the reasons behind it.
These efforts should form a continuous cycle rather than a series of one-time fixes. By combining player insights, targeted improvements, and post-update monitoring, game teams can respond to changing player needs and keep improving the game experience. Ultimately, stronger retention comes from giving players meaningful reasons to return, not simply from trying to improve a single metric.
FAQs
Why do mobile game retention benchmarks differ between reports?
Reports use different samples, periods, markets, acquisition sources, and retention definitions. They may report averages, medians, or top performers. Check the dataset and methodology before comparing results.
What is the difference between classic and rolling retention?
Classic retention counts players who return on a specific day; rolling retention counts those who return that day or later. A player returning on Day 8 but not Day 7 counts toward rolling D7, but not classic D7. Compare figures using the same definition.
How long should I wait to evaluate retention after an update?
Each cohort must reach Day 7 for D7 or Day 30 for D30. Monitor crashes, login failures, and feedback immediately, but wait for enough mature cohorts to assess retention. Where possible, use A/B testing to separate update effects from traffic changes or seasonality.
Which should I prioritize: D1, D7, or D30 retention?
Start with the checkpoint underperforming against comparable cohorts. Weak D1 warrants checking onboarding and technical performance. If D1 is healthy but D7 or D30 is weak, investigate progression, rewards, and content. Validate the cause with behavioral data and player feedback before choosing a fix.